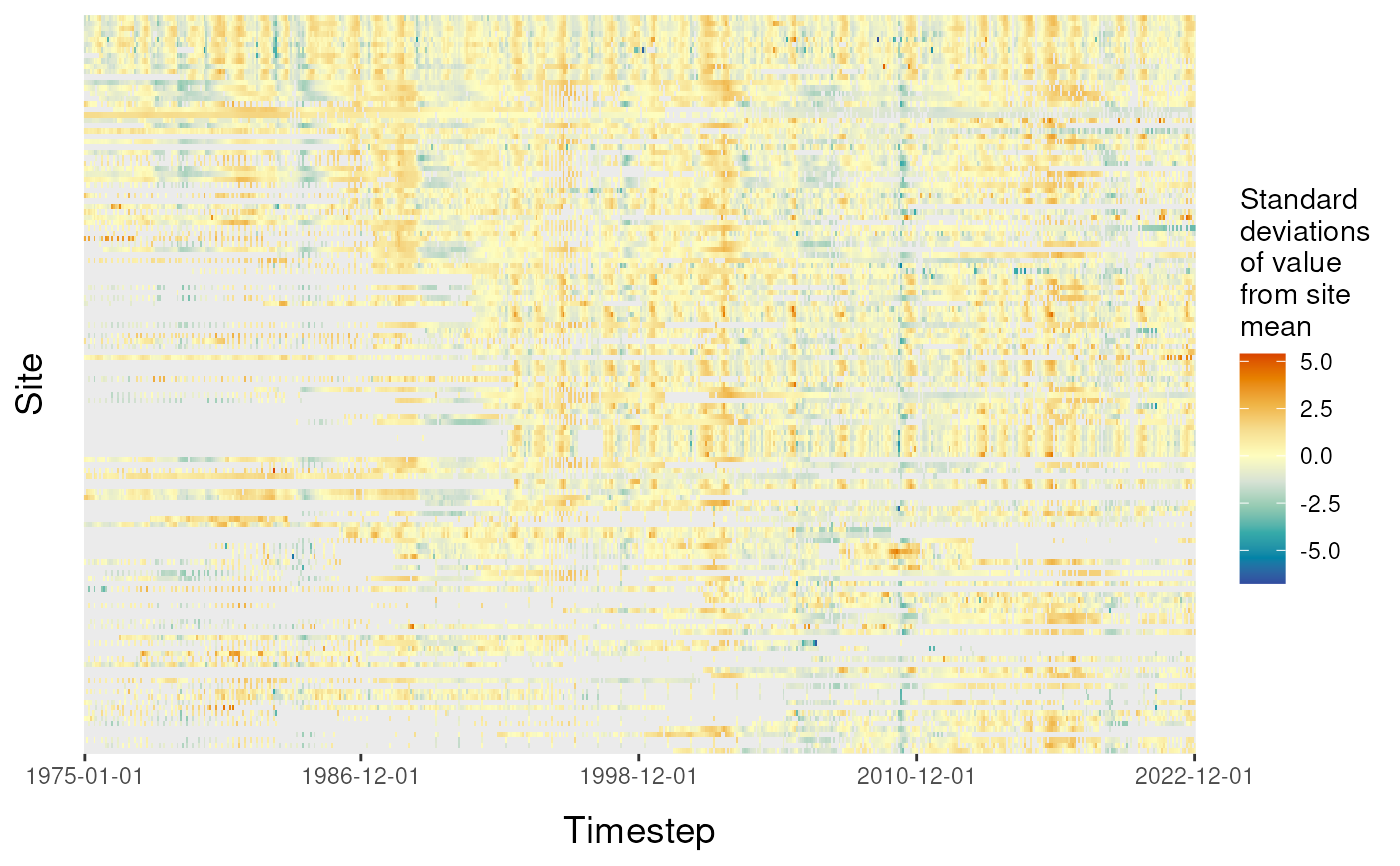
Create heatmap of timestep grid
grid_heatmap.RdCreates heatmap of input data frame values where rows are timesteps and columns are sites to visualize dataset scale correlation structure and missingness patterns. Can z-score standardize values by site to visualize relative temporal patterns in dataset.
Usage
grid_heatmap(
  grid,
  data_thresh = NA,
  order = "completeness",
  site_order = NA,
  zscore = T,
  rv_cb = T,
  cb_rng = NA,
  x_axis_breaks = 5,
  rnd = 3
)
Arguments
- grid
data frame where rows and columns represent timesteps and sites, respectively. Accepts output from
timestep_gridandimputed_gridin output list ofimpute_grid.- data_thresh
site completeness threshold. Only visualize columns (sites) with less than this proportion of observations (non-
NA- not assigned - values) in constituent rows (timesteps). Default isNA(show all sites).- order
character string specifying site plotting order. Can be set to
"completeness"(order sites by proportion complete),"cluster"(order sites by hierarchical agglomerative clustering), or"custom"(supply custom site order as vector usingsite_orderargument). Default is"completeness".- site_order
character vector describing custom site plotting order. Automatically removes leading "X." prefixes to site identifiers if present. Default is
NA.- zscore
logical flag to z-score standardize observed values by site before plotting. Default is
TRUE.- rv_cb
logical flag to reverse colorbar scale. Default is
FALSE.- cb_rng
two element numeric vector setting colorbar range. If values fall outside the specified range, colors are saturated at extremes when plotted. Default is
NA, which autoscales colorbar range to the data.- x_axis_breaks
number of tick marks and labels to include on x-axis. Default is
5.- rnd
number of digits to round values to for plotting on heatmap. Default is
3. Set toNAto suppress rounding.
Value
named list containing:
- grid_plot
ggplotobject created usinggeom_raster.- site_order
character vector of site plotting order.
Author
Maintainer: Zeno F. Levy zlevy@usgs.gov
Examples
# load example Long Island dataset
  data(LI_data)

# grid data at monthly timestep using median observed values
  grid <- timestep_grid(data = LI_data,
                        timestep = "monthly",
                        agg_method = "median")

# visualize heatmap of timestep grid
# only show sites that are at least 35 percent complete
  hm <- grid_heatmap(grid, data_thresh = 0.35)
  hm$grid_plot